Andrew Zacharias, Deputy Director, Monitoring & Evaluation
Introduction
This report is intended to provide an introduction to the Trees for the Future (TREES) Monitoring & Evaluation Aerial Surveying Program, the TREES Leaf Area Index indicator and its relationship to microclimates, the Above-Ground Biomass metric, and an analysis of the Baseline and Year 1 data collected in the Senegalese villages of Diamagadio and Salam 2 as a part of the Kaffrine 3 project from August 2018 to June 2019.
Drones and Agricultural Monitoring
Recent technological improvements in hobby and professional-grade unmanned aerial flight has provided researchers newfound tools to observe the physical attributes of objects and environments that were traditionally too remote and rugged to cost effectively access. Unmanned Aerial Vehicles (UAVs), colloquially referred to as “drones”, are now cheap and efficient platforms to collect high resolution multi-spectral imagery that have many advantages and flexibilities over services offered by satellites and manned aircraft. UAVs fly under the cloud cover that interfere with satellite operations and fly much closer to the ground, resulting in images with much greater resolution compared to their competitors. This presents unique opportunities for organizations interested in leveraging new frontiers to better monitor land-use and land cover change, environmental impacts, and other indicators that can be measured with photogrammetry.
In the agricultural industry, drones have revolutionized the way farmers monitor their crop systems. Using multispectral cameras, analysis of drone-sourced data can provide deeper insight into the health of plants, yield estimates, and more efficient application strategies to increase profits and decrease environmental harm.
Trees for the Future Environmental Monitoring
Trees for the Future’s Monitoring and Evaluation system tracks a number established indicators to measure the impact of the Forest Garden Approach on food security, dietary diversity, economic resilience, and agricultural production. In a bid to empirically prove the environmental impacts of the Forest Garden, TREES began using drones in 2018 to monitor the annual development of participating fields. The products of the studies include a photographic time-series of the Forest Gardens as well as a time-series of above-ground biomass measurements and leaf area indices, which track the Forest Garden’s ability to store water and maintain microclimates.
Drone Data Collection Process
The process by which TREES produces these metrics takes several steps. First, drone pilots are dispatched to participating Forest Gardens at least once a year. Ideally, this is done just before the rainy season when plant-life outside of the Forest Garden is at its lowest point and observers can easily see the differences in farming approaches. Once on site, the pilots conduct two flights. During the first flight, the drone carries a standard, consumer grade, point-and-shoot Canon S100 camera. This captures 200 to 300 photographs of the Forest Garden at 100 to 150 feet above ground level. These photos are similar to those taken with a phone or camera and produces photos in the red, green, and blue wavelengths. This paper will refer to these photos as RGB. The second flight carries another Canon S100 camera that has been modified to capture the near infrared wavelength as well as the green and blue wavelengths. This paper will refer to these photos as NIR. It is important to capture the NIR photographs as plants reflect the near infrared wavelength differently than other materials do and, while invisible to the human eye, computer analysis can help us to make important measurements based on these reflections.
After the drones have finished collecting the photographs, the data is stored on a computer and brought to a TREES office where further processing can be done. This processing stitches the two datasets into high resolution, orthomosaic images (or maps) as well as 3-D models. These two products are then used to calculate the TREES Leaf Area Index (T-LAI) and the Above Ground Biomass (AGB).
TREES Leaf Area Index (T-LAI)
The Relationship between Leaf Area Indices and Microclimates
Microclimates are the climates of very small or restricted areas, distinct from those in the immediate vicinity. The creation of a cool, humid microclimate is a key product of the Forest Garden Approach as it allows the Forest Garden to retain water more effectively and produce more food for longer periods of time. One key indicator that we can use to measure the establishment of microclimates is the leaf area index (LAI) of an area. Researchers have found compelling evidence that “LAI plays an important role in controlling microclimate within tropical forest ecosystems” (Hardwick et al. 2014, p. 191) and that an increase in vegetation has close relationships with air temperature, relative humidity, vapor pressure deficit, specific humidity, and soil temperature (p. 187). This is accomplished primarily through tree canopies blocking the wind and sun that would otherwise reach the farm’s soil. These added vegetative protections keep the microclimate cool and encourages evapotranspiration, thus increasing the air’s capacity to hold water vapor and increasing humidity. In the context of Forest Gardens, this means more water is held on the farm and available for crop growth. This also means that the land experiences significantly less soil erosion from reduced wind in the dry seasons and fast flowing water during the rain seasons. In short, measuring higher T-LAI scores means better growing conditions for the Forest Gardener.
Calculating T-LAI
Calculating LAI traditionally requires invasive and destructive methods, including cutting of vegetation for measurement. Recently, with the advent of easily-accessible multispectral sensors, researchers have been investigating the relationship between LAI and Normalized Difference Vegetation Index (NDVI – which can be derived from RGB and NIR photos). Although these studies have found that NDVI is an effective way of estimating LAI in-situ (Fan et al. 2007, p. 151), there is currently little scientific agreement in the appropriate equations and processes used to estimate LAI from NDVI. Because of the lack of consensus and the basic needs of the organization to merely prove and track an increase in perennial leaf biomass, TREES has created their own leaf area index model called the TREES Leaf Area Index (T-LAI). By simply quantifying the area of a Forest Garden that is covered by plant-life (as identified through NDVI analysis), TREES can take a well-informed position on the effectiveness of the Forest Garden Program to increase perennial plant-life in a sustainable, agricultural system. Ultimately, this process is similar to those used in other farm systems where agriculturalists use drones and remote sensing to catalogue their fields.
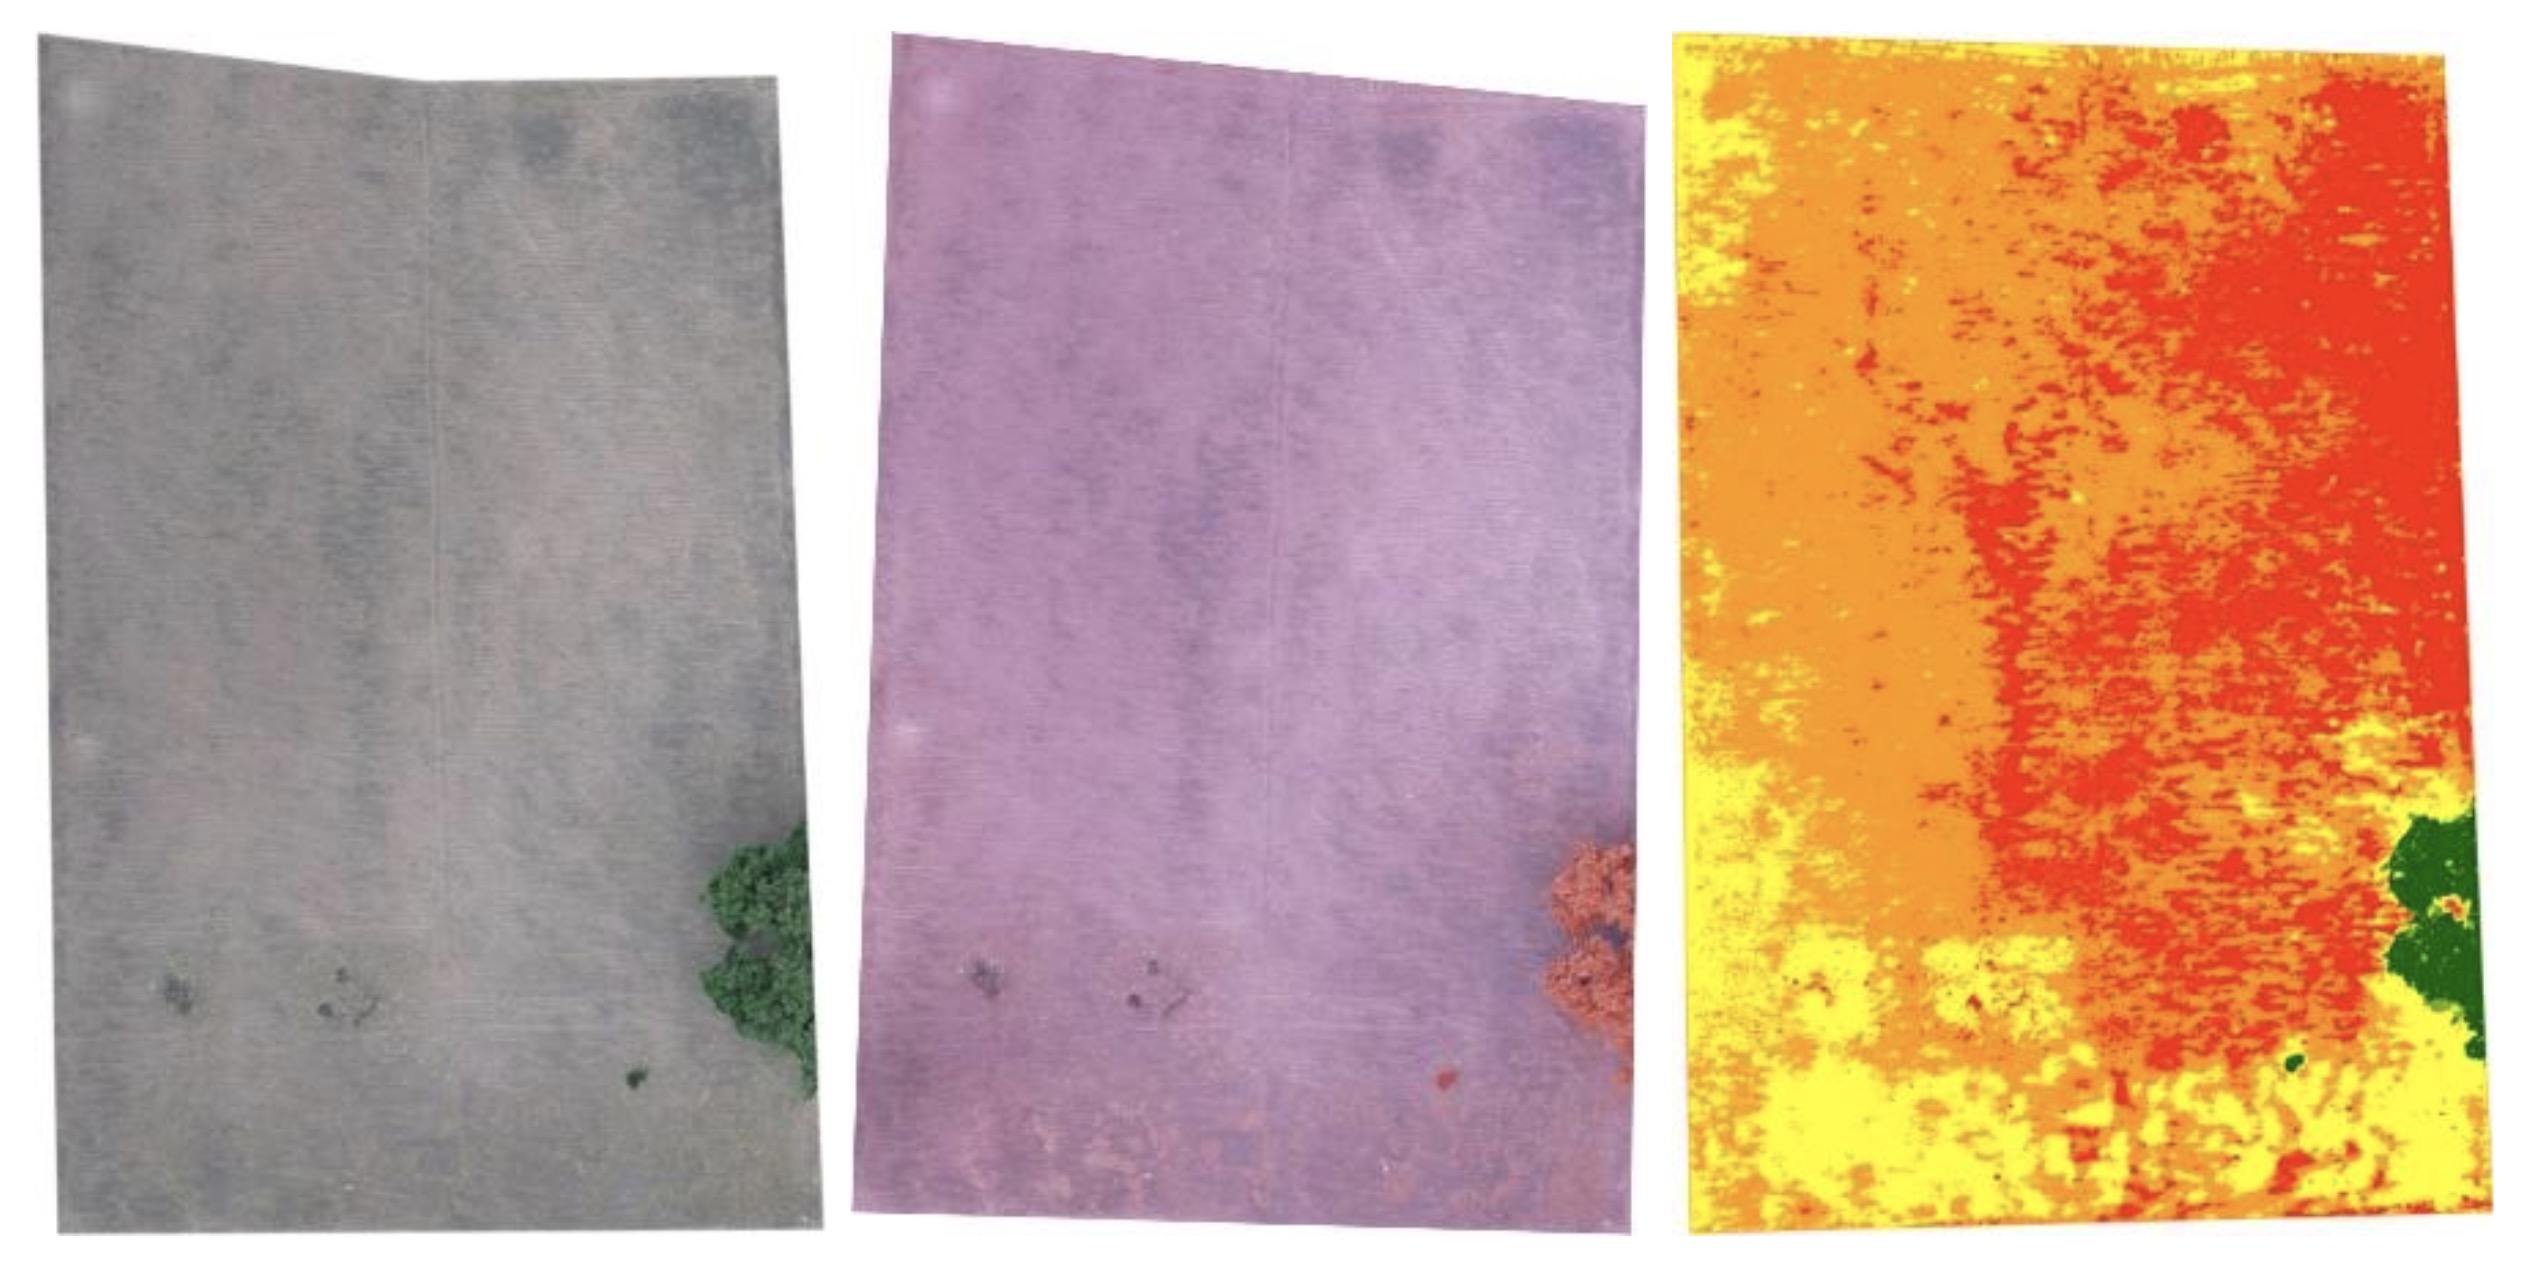
Calculating T-LAI is a three-step process: First, an orthomosaic of multispectral images of the Forest Garden area are imported into a geoprocessing application, such as ArcGIS or QGIS. During the import, the images are separated into its different wavelengths, or “channels”. The RGB images have Red, Green, and Blue channels while the NIR images have near-infrared, Green, and Blue channels. The image is then processed to produce an NDVI layer using the universally accepted NDVI formula:
NDVI = (NIR – RED) / (NIR + RED)
Some sensors available on the market produce what is called BNDVI (Blue Normalized Difference Vegetation Index), which uses the Blue spectrum as opposed to the Red spectrum for NDVI calculation. In such cases, the formula would look like this:
BNDVI = (NIR – BLUE) / (NIR + BLUE)
The results are effectively the same in that it differentiates between synthetic material, soil, and plant-life. Furthermore, some GIS processors like ArcGIS have a built-in NDVI tool that calculates NDVI values from RGB images, drastically reducing processing time requirements.
After the NDVI layer is created, the NDVI categories are manually adjusted to isolate the perennial plant-life from any existing weeds or dying field crops. Ideally, this step would not be necessary by planning the aerial surveying dates around the driest times of the season where no crops or weeds are present in the field. After the NDVI categories have been properly adjusted, the layer is exported as categories, with the highest value category consisting of the perennial leaf features.
The third part of the process involves exporting this new layer as a table of values into Excel. The leaf feature category is then calculated as a percentage of the total features in the table. This produces the T-LAI figure. If, for example, there are 5,000 leaf features in the table of 125,000 features, the T-LAI would be 4.00.
( 5,000 x 100 ) / 125,000 = T-LAI 4
A goal is also calculated for the participant during the baseline T-LAI calculation. A rough benchmark has been set at T-LAI 8 for all participants. However, if a participant is closer to the goal at the beginning of the program, TREES would like to see them move beyond the minimum of T-LAI 8. TREES sets the variable goal by dividing their baseline T-LAI in half, then adding the 8 minimum. As a formula, it would appear as follows:
T-LAIgoal = ( T-LAIbaseline / 2 ) + 8
This allows the participant to be challenged in their progress while also remaining reasonable in what the program can expect of them. The standard T-LAI goal of 8 is based on the observations on a very limited number of Forest Gardens. As TREES continues to monitor the development of Forest Gardens, the organization can set better-informed goals based on past experience.
Above-Ground Biomass (AGB)
Above-Ground Biomass (or “AGB” for short), is defined by the Food and Agriculture Organization of the United Nations as, “All living biomass above the soil including stem, stump, branches, bark, seeds and foliage” (Schone et al). AGB is critical in the fight against climate change as it is an important mechanism of carbon sequestration. As the amount of biomass increases on Forest Garden sites, the capacity to sequester carbon from the atmosphere also increases.
TREES measures AGB using the same datasets used to measure T-LAI. First, photographs are captured by drones flying overlapping rows above the survey area. The resulting hundreds of photographs are then processed with the modeling software, Agisoft PhotoScan, that creates a 3D model of the Forest Garden. This georeferenced model is created to scale and measurements can be derived from it. The Forest Garden area is then isolated from the rest of the model and a measurement tool in the software is used to calculate both area and volume. The volume metric is the AGB and recorded year to year to show the growth of plant material on the Forest Garden site.
During the baseline AGB measurement, initial goals are calculated using a formula that produces a weighted value. The baseline figure is first multiplied by 0.66 and then added to a standard 500 m3. This allows for ambitious goals to be set for those Forest Gardens with very small baseline measurements while allowing for realistic goals to be calculated for those with larger baseline measurements. The standard 500 m3 figure, similar to the T-LAI goals, was selected by analyzing a small number of existing Forest Gardens. As the datasets created by the UAV program continue to grow, TREES expects this figure to change in order to create better-informed goals that challenge participants to manage levels of biomass that are indicative of ideal Forest Garden Systems.
Aerial Monitoring in Kaffrine, Senegal
Project Introduction
Senegal is the largest international hub and economic center in West Africa, but much of its population lives in rural farming communities on less than $1 a day. According to 2012 data from the UN World Food Program 2012, Senegal is chronically vulnerable to natural disasters (particularly drought and flooding), its agricultural sector has declined over time, it imports about 46% of its food requirements, its ground water tables are falling 20 feet per year in many places, and it is vulnerable to food price spikes.
Trees for the Future, with the support of Ecosia, established a third Forest Garden project near the crossroads town of Kaffrine in central Senegal in 2018. The project area includes 10 villages located between the village of Diamagadio in the west, and Diacksao in the east. The population in this area is experienced in livestock management, commercial farming, and market gardening, although the latter has been challenged by infrequent and unpredictable rainfall patterns. Furthermore, fertile farmland has become increasingly scarce because of peanut monoculture farming and its proximity to a protected forest area, which prevents the expansion of farming. However, the market potential is strong. Agricultural products are easily sold in the city of Missirah (which is one of the largest livestock markets in Senegal) and Kaffrine. Individuals and businesses drive from these cities to these rural villages to get high-quality garden products like fruits and vegetables.
Data Collection Scope & Process
At the time of the aerial survey, there were 206 farmers registered in the project. From this cohort, 15 were selected to participate in the aerial survey. The selection was done in a non-randomized fashion and relied on the farms’ features and how accessible they were to the drone, as well as the perceived level of engagement shown by the farmer. Participants who showed great interest in FGA technologies and a readiness for adopting new techniques were screened for inclusion in the study. This was done to decrease the risk of losing a participant before graduation, which would directly result in an expensive loss of investment in the aerial study. After visiting 20 farms, the 15 participants were selected and aerial flights were conducted. Equipment and logistic limitations allowed TREES staff to conduct four surveys per day. In the morning, staff would visit two fields, flying a total of four flights: one flight per field with the RGB sensor and one flight per field with the NIR sensor. The first surveys were done in August 2018 and a second survey was conducted in June 2019.
After data collection activities were complete, the resulting photo sets were opened in Agisoft PhotoScan and processed into orthomosaic images and 3D models. The RGB orthomosaics served as maps for visual observation of FGS features and for AGB measurements while the NIR orthomosaics were imported into ArcDesktop for NDVI classification and T-LAI analysis. In ArcDekstop, some work was necessary to isolate the perennial tree canopy in contrast to other on-field plant-life. For explanations on both of these two points, please refer to Challenges & Limitations.
Challenges & Limitations
Most challenges staff encountered were related to power availability – both battery supply and electrical access proved problematic. TREES drone equipment included five rechargeable 3DR Solo batteries and an adequate number of chargers to charge them simultaneously. However, as each flight typically required one fully-charge battery, staff were limited to flying two Forest Gardens in the morning, breaking to charge in the field, and flying two Forest Gardens in the afternoon. A proposed solution would be to purchase additional batteries for field use. By merely increasing the battery supply to six, TREES could effectively increase their surveying activities by 50%. Obstacles to implementing these solutions include funding and travel logistics (which could be negated by leaving equipment in-country).
The other issue with electricity was access to a reliable source while in the field. The power to local communities was often cut, leaving us to either pay for generator use in neighboring communities or cease data collection activities for the day. Part of the planning for next year’s visit will include renting transportation that will allow staff to carry a gas generator in case of widespread electrical outages.
Results
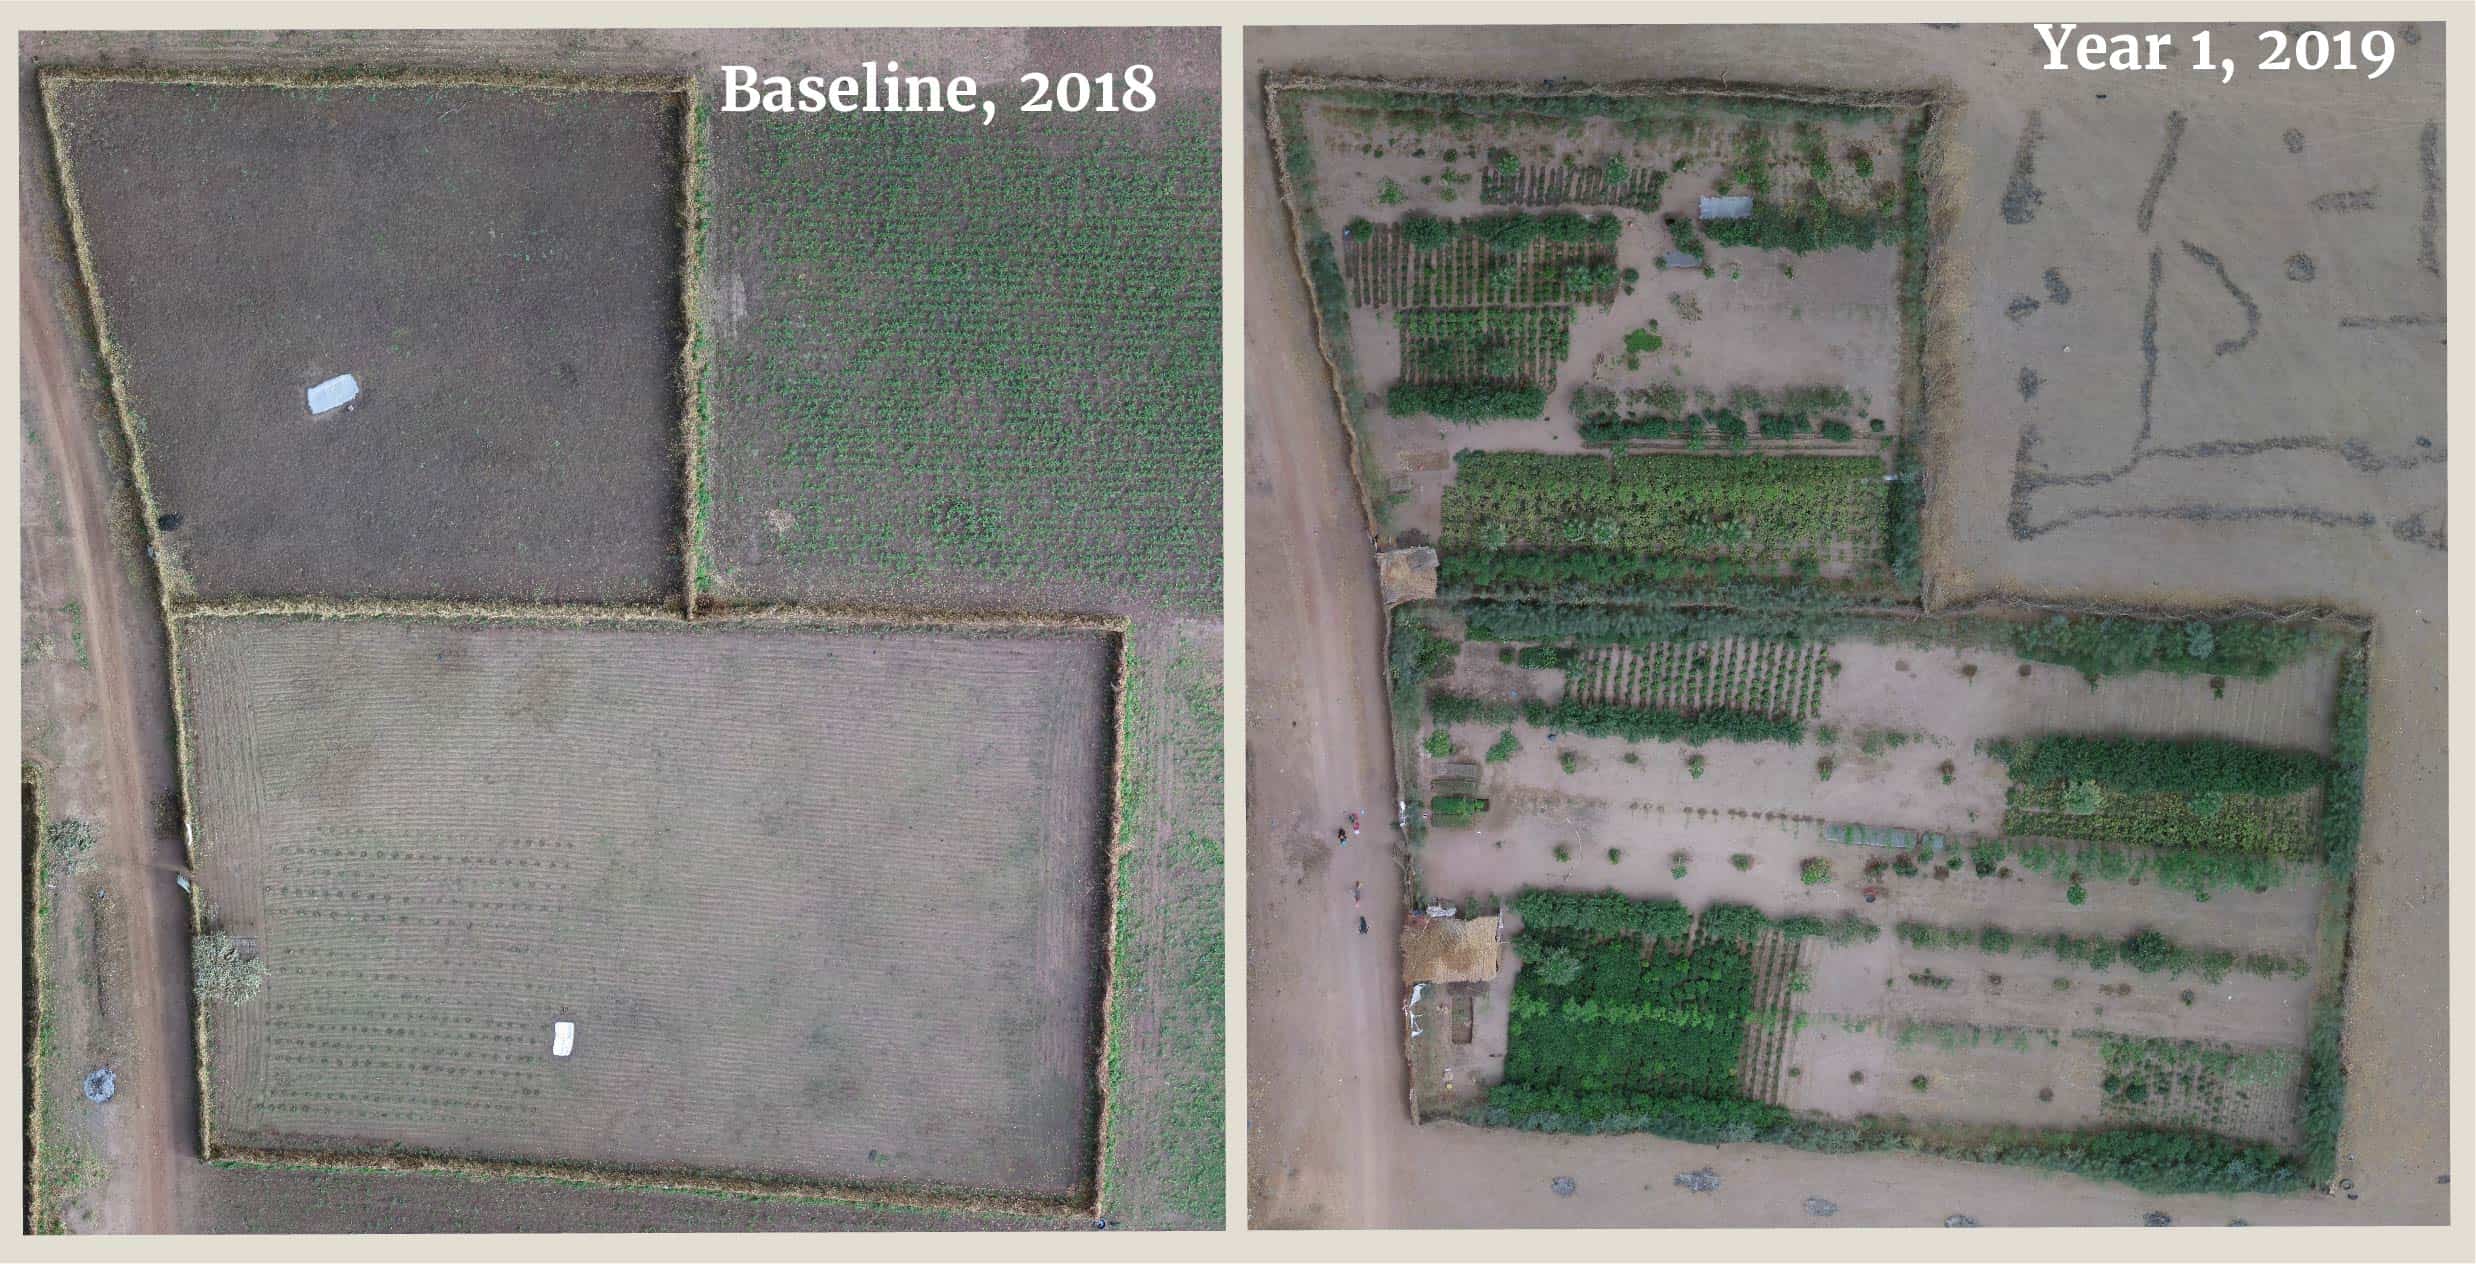
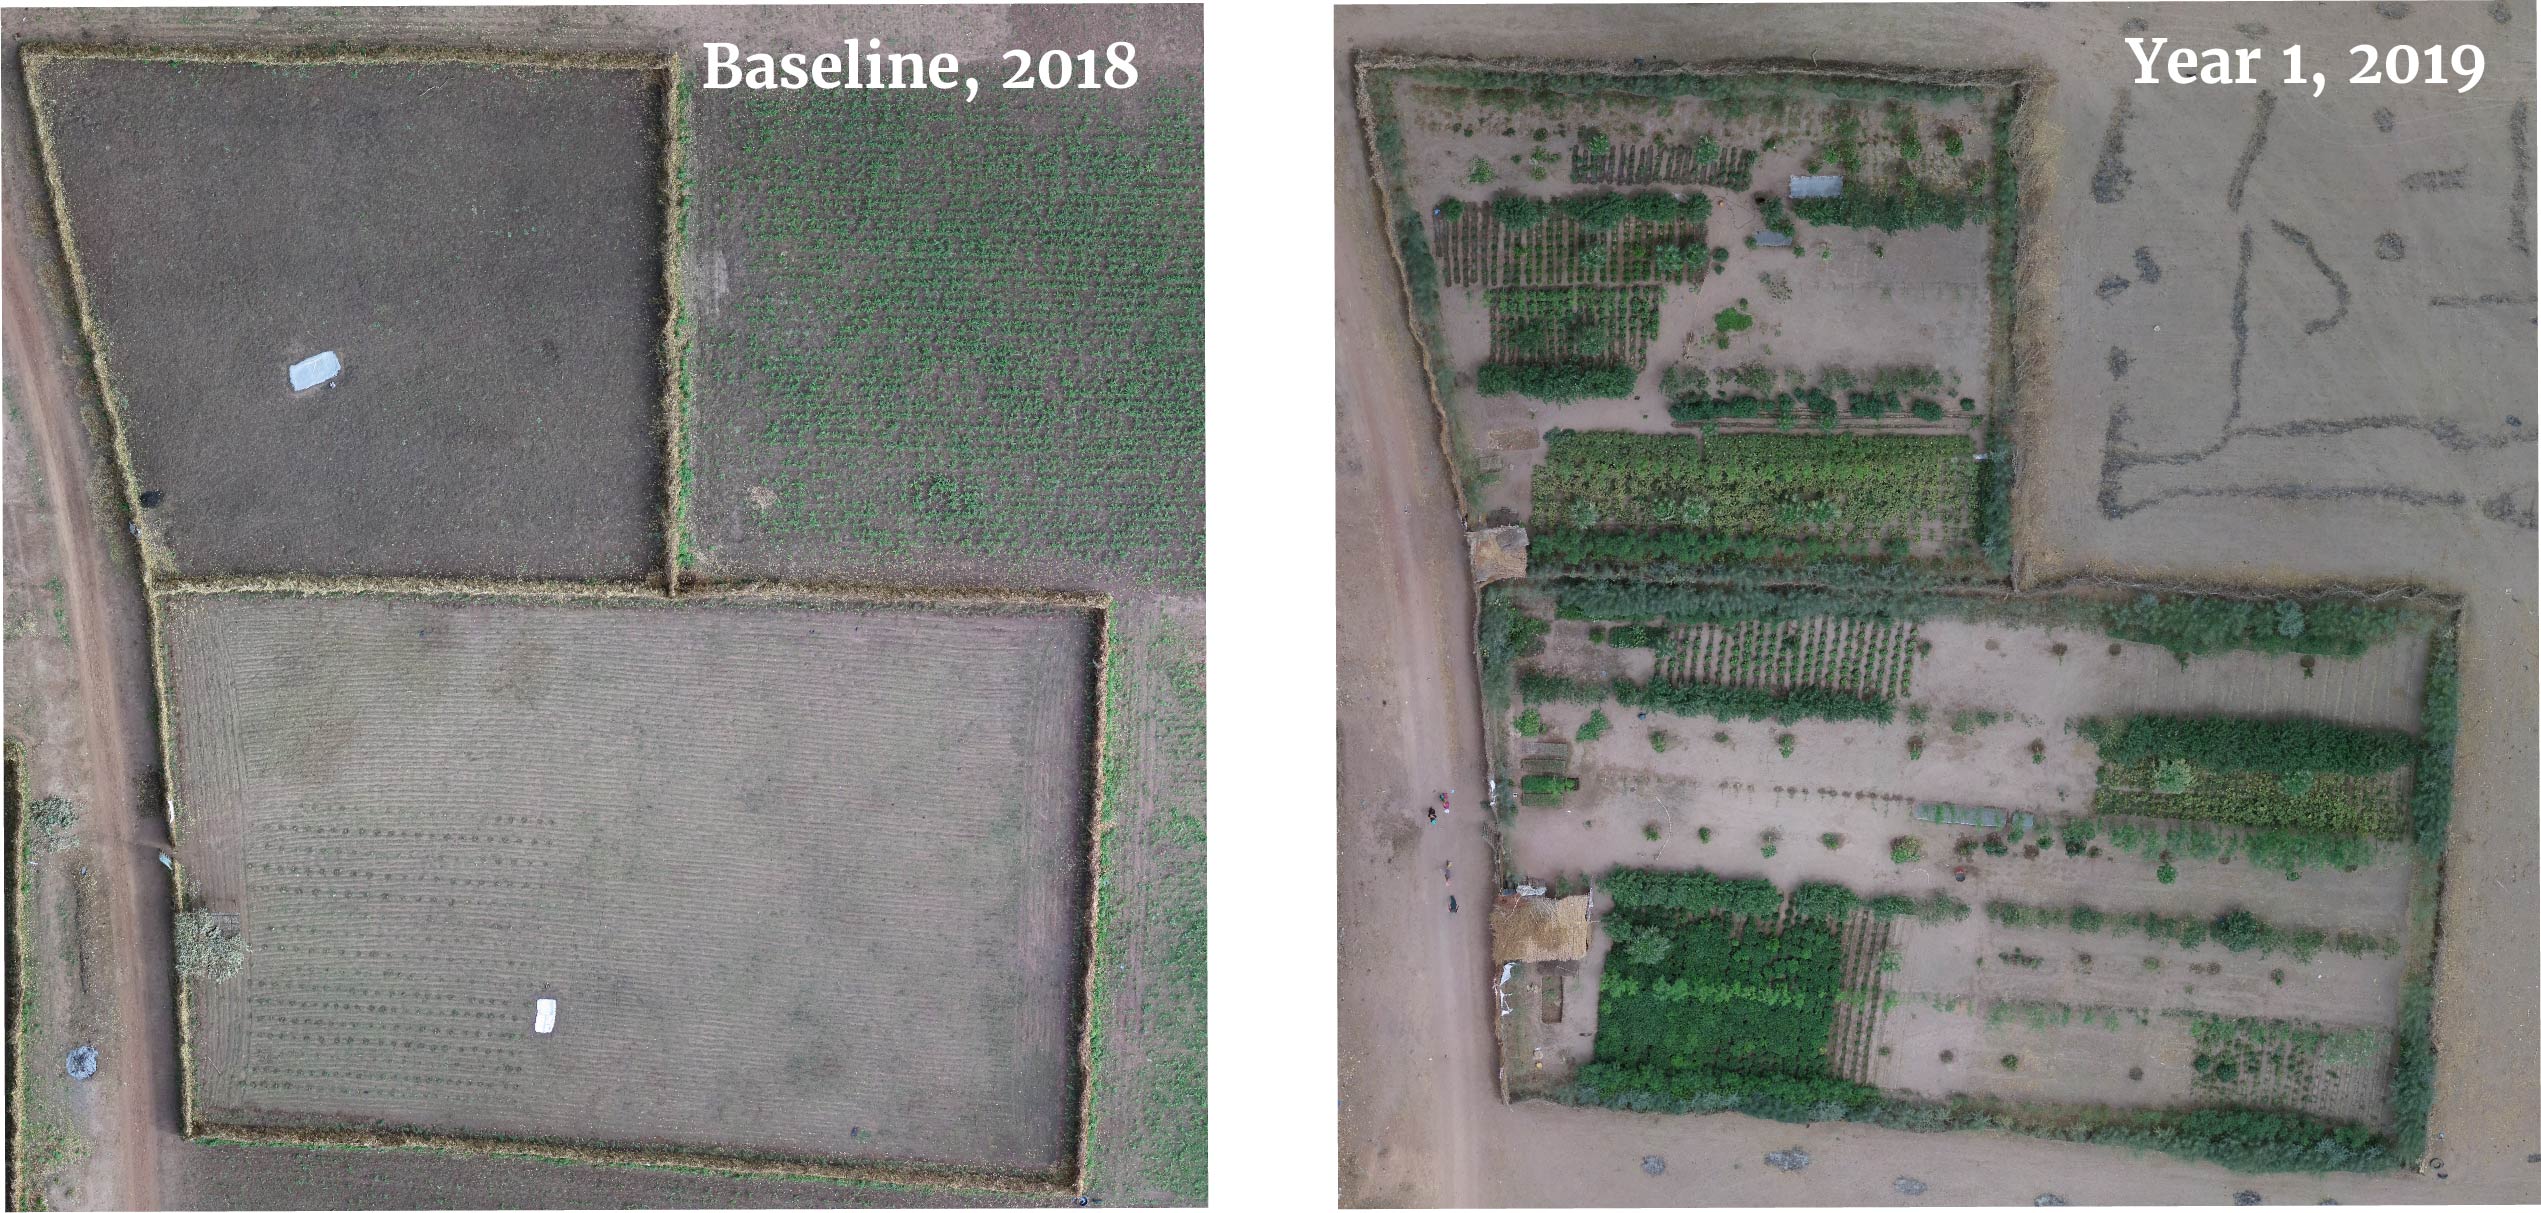
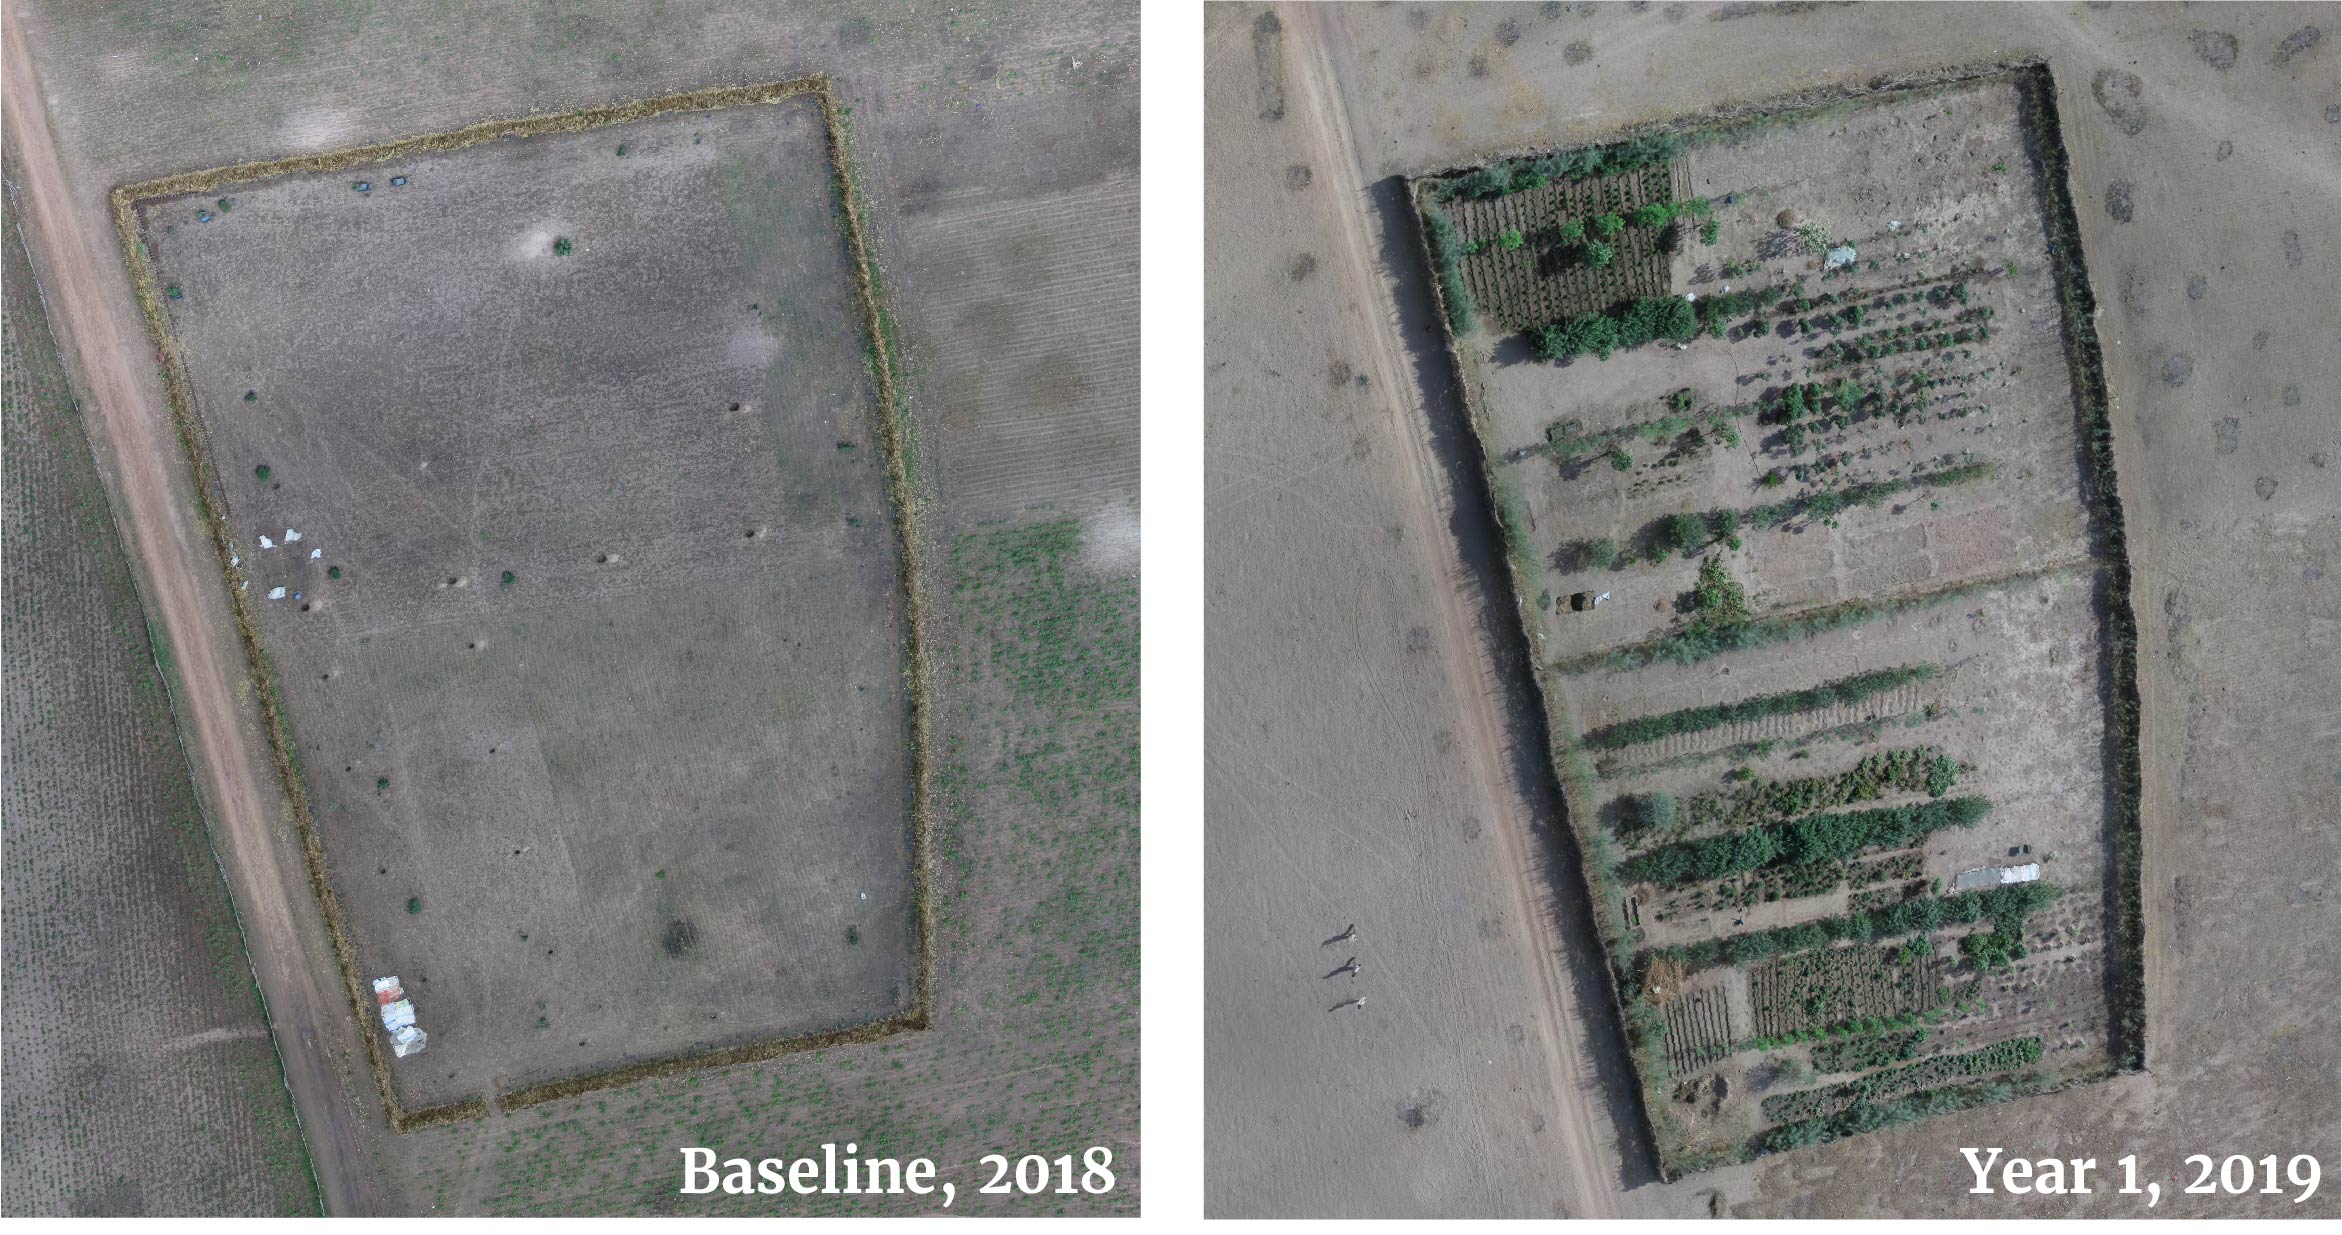
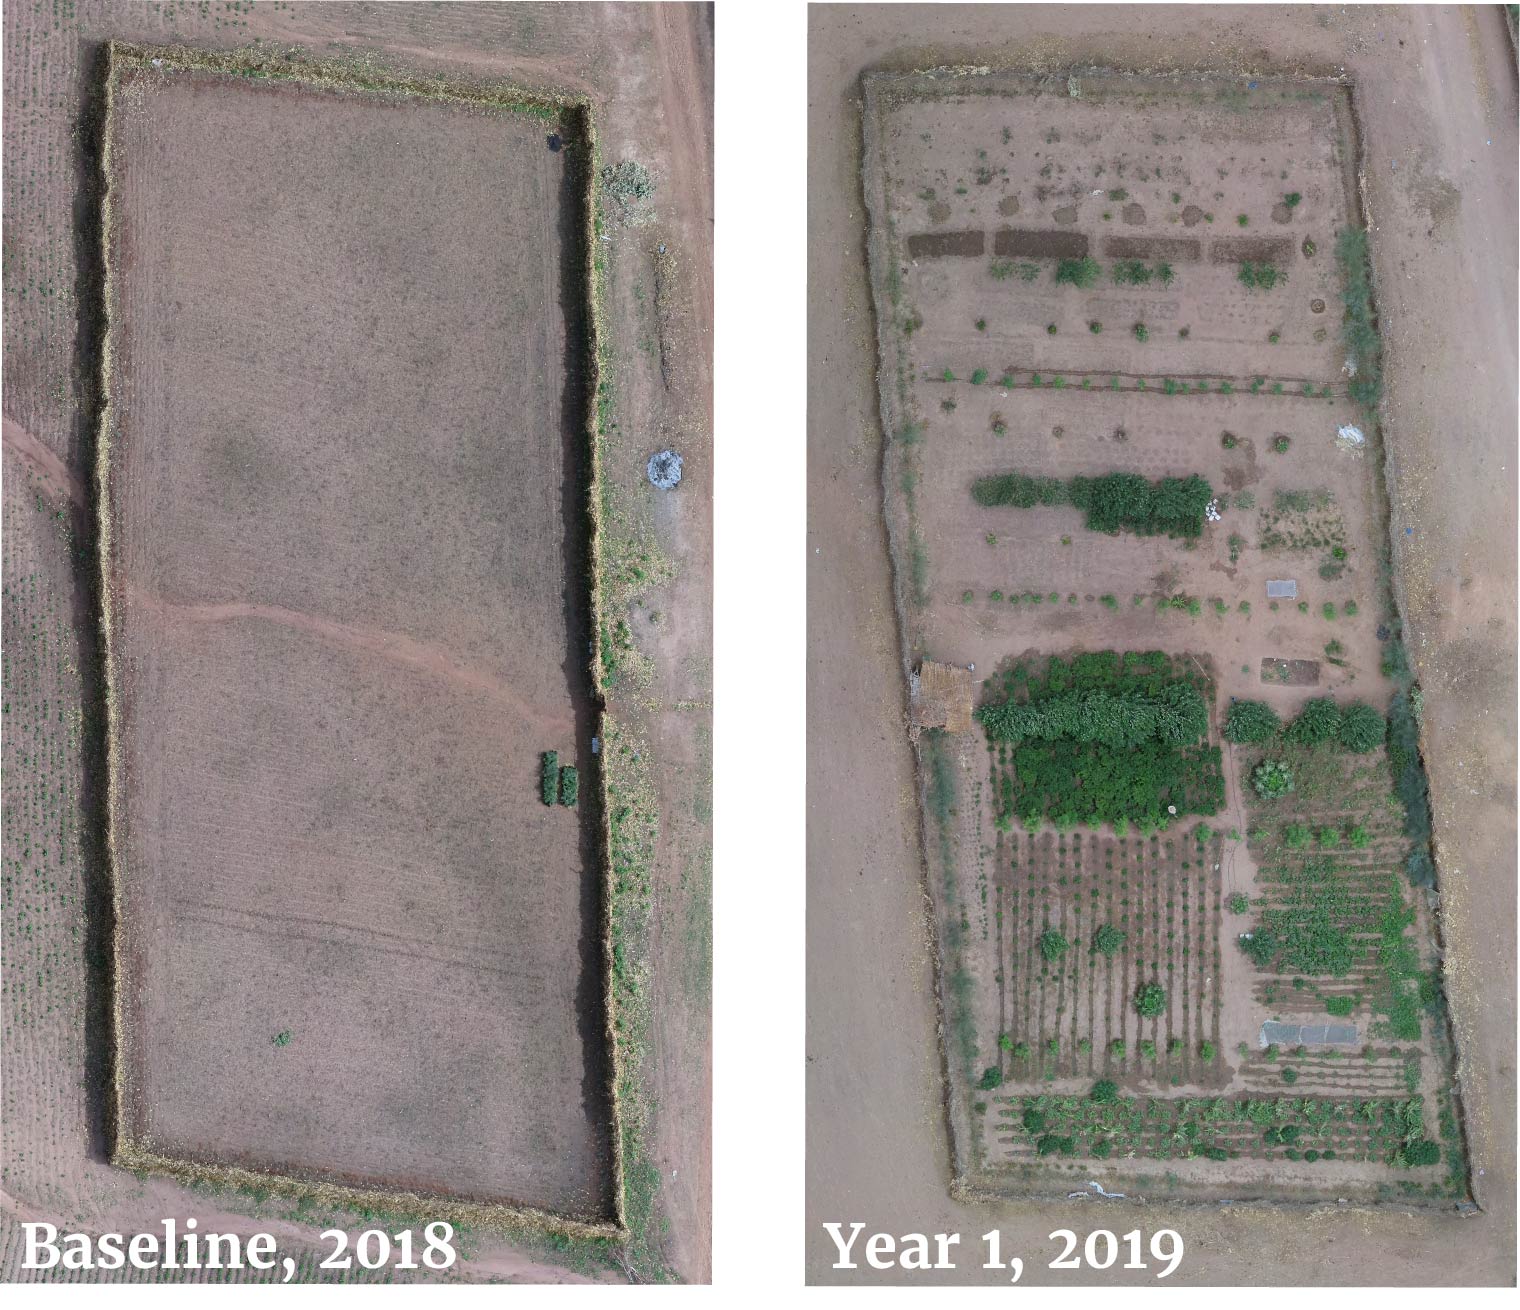
As this project began in April 2018 and the aerial surveys were conducted in August 2018, all 2018 data reflects a “baseline” measurement and the results can be considered pre-intervention as no (or largely minimal) tree planting activity had taken place.
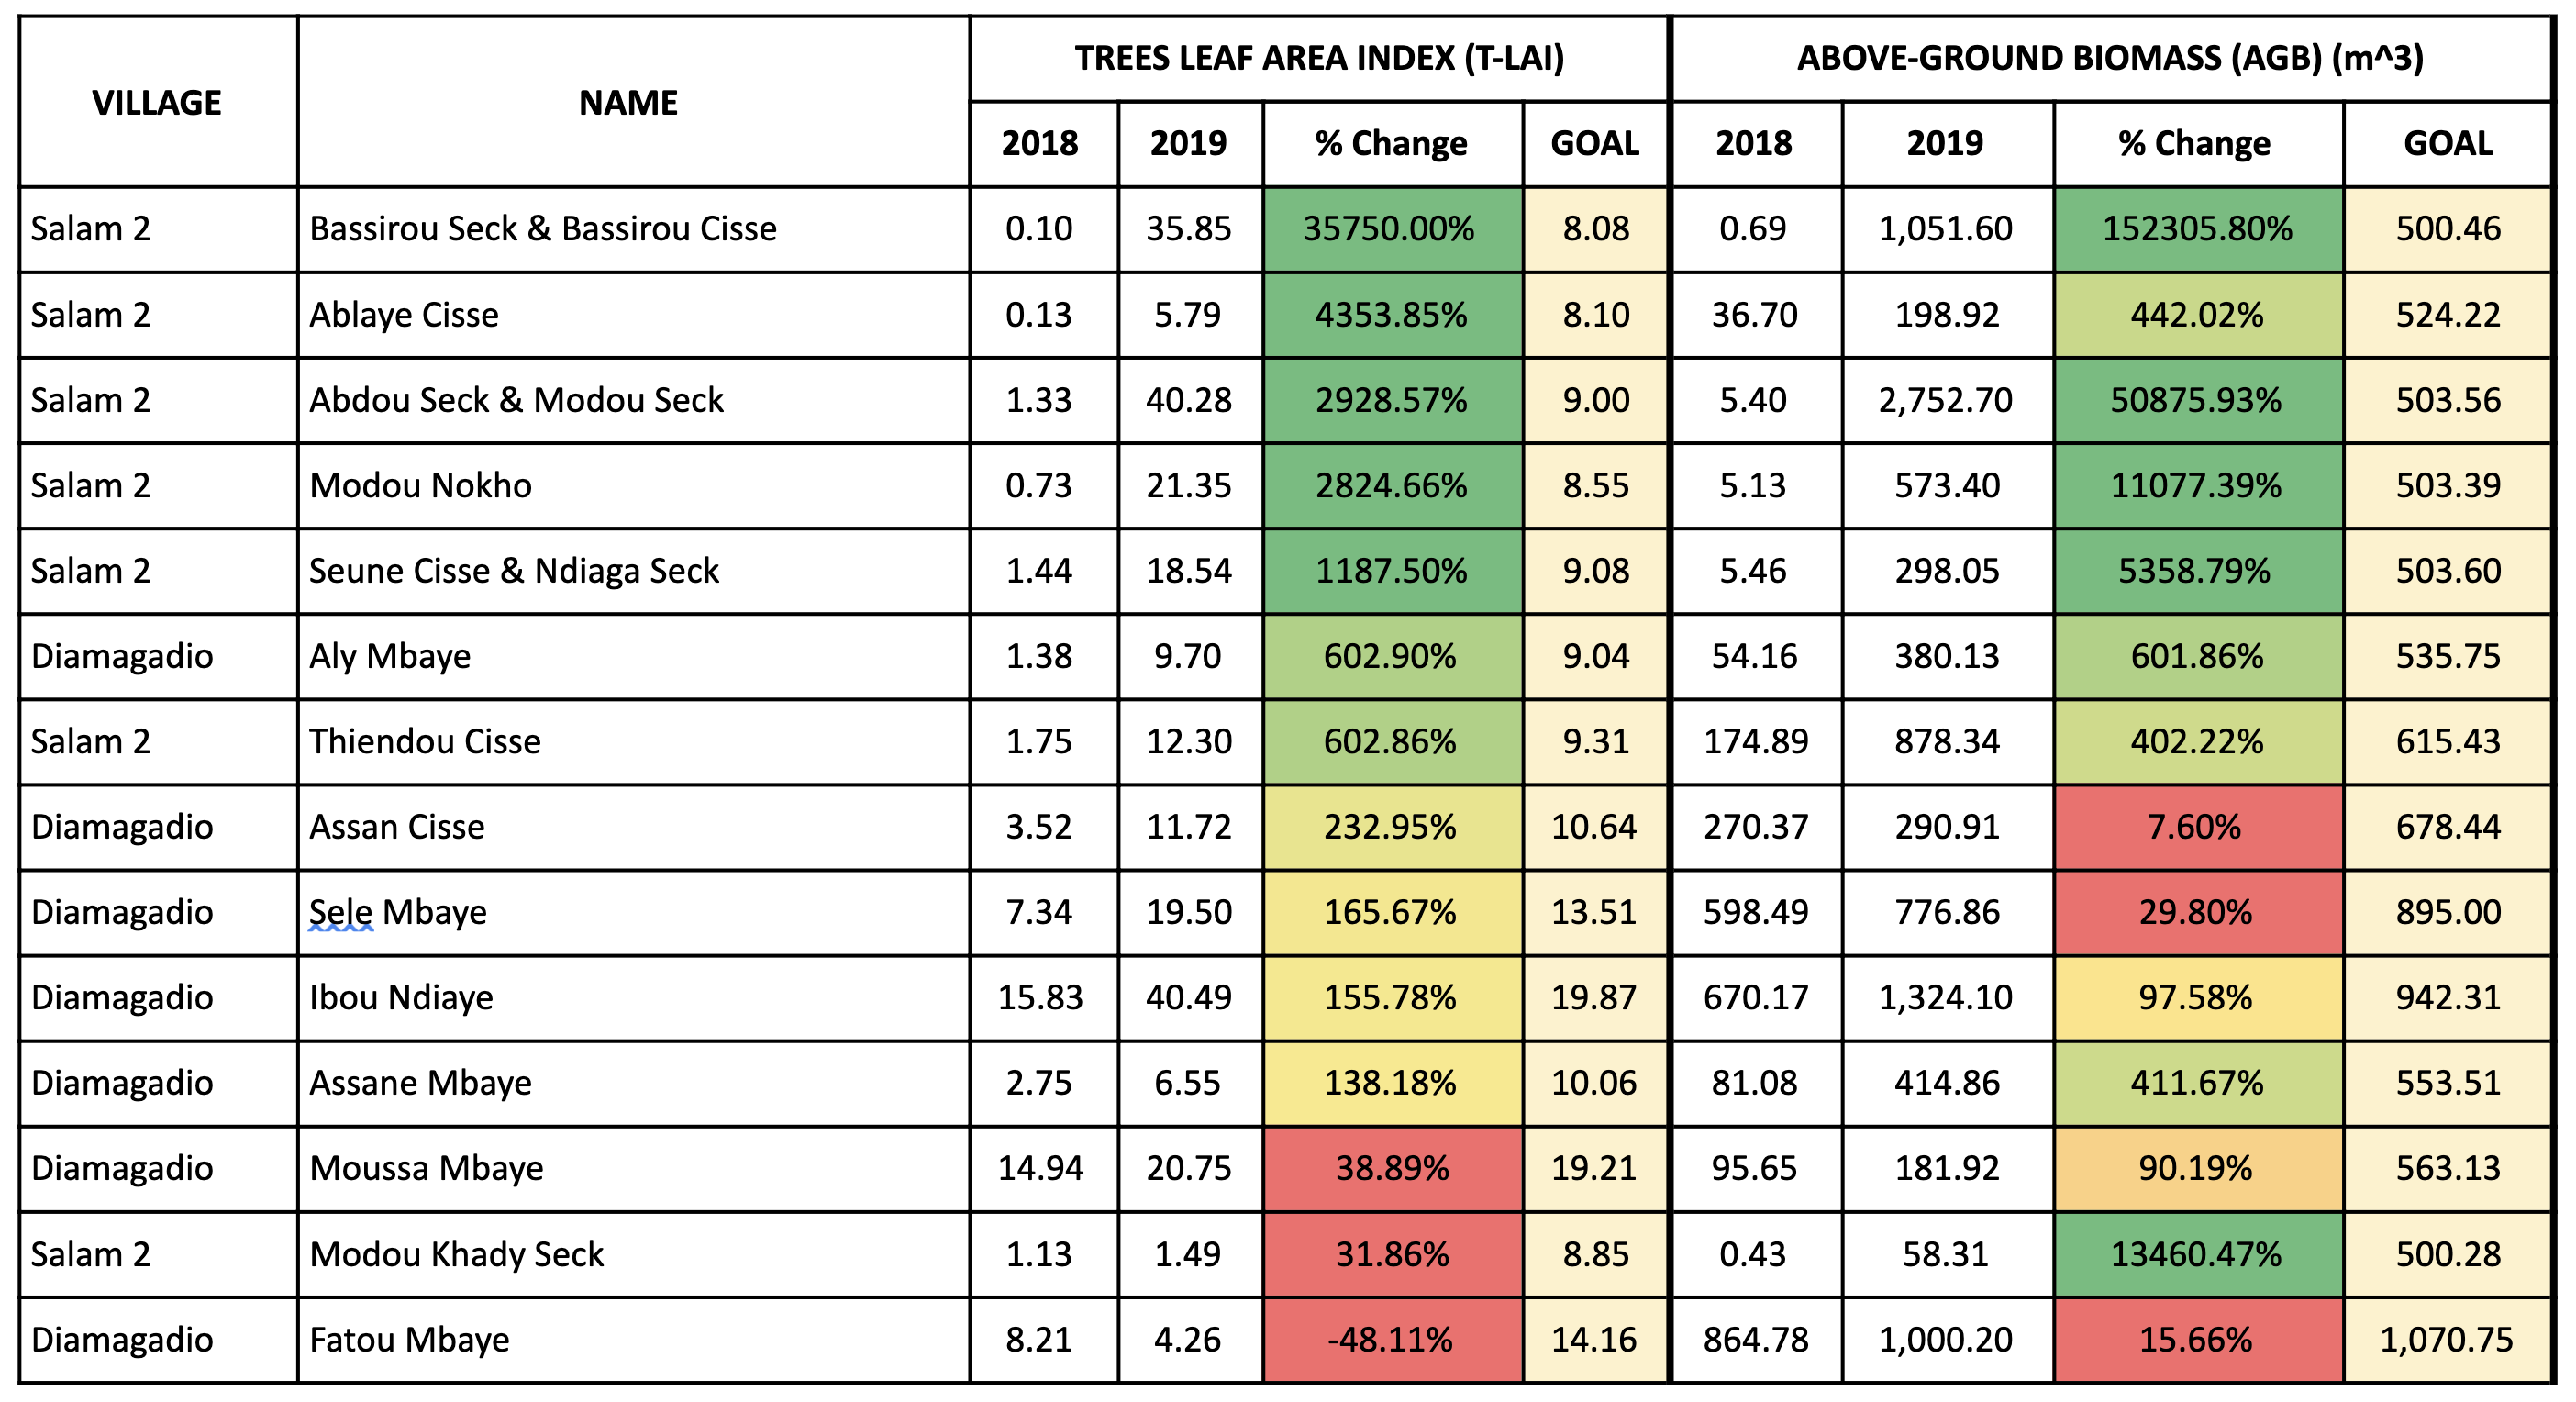
As noted in the previous sections, TREES uses two indicators for tracking the environmental impact of the Forest Garden System: Leaf Area Index and Above-Ground Biomass. The T-LAI measurements reflect a varying degree of perennial leaf presence. Some of the surveyed Forest Gardens have mature trees either inside or overhanging the Forest Garden boundaries while others are completely devoid of plant life. While many Forest Gardens were unable to produce baseline T-LAI measurements, all Forest Gardens received a T-LAI goal using the methodology described earlier in this report. As workshops are conducted and trees are outplanted onto these Forest Gardens, we expect to see the T-LAI increase substantially and pass their stated goals well before the end of the project timeline.
An analysis of the Year 1 datasets show that these expectations were almost universally confirmed. Virtually all of the surveyed Forest Gardens showed increased T-LAI scores, with some exceeding their calculated goals by impressive rates. As TREES continues to monitor Forest Garden projects with T-LAI, it can better identify desired T-LAI levels and designate goals based on those figures.
The AGB measurements, similar to the T-LAI measurements, show Forest Garden systems with a varying amount of biomass already present at the start of the project. To take this into consideration, unique goals were set for each of the participants using a set formula in order to push each farmer to increase the amount of carbon-sequestering, nitrogen-fixing, resource-laden biomass that will help to create the sustainable system of agriculture around which the Forest Garden Approach is built. As with the T-LAI goals, the ability to more accurately set goals will increase as the aerial surveying program continues to monitor Forest Garden developments.
AGB measurements in Year 1 saw increases in every surveyed Forest Garden. Where participants encountered setbacks like livestock interference or high tree mortality rates, AGB increases were modest. Where participants were able to implement the Forest Garden Approach adeptly, AGB skyrocketed. On average, AGB increased by 16,798.35%, an impressive number that directly relates to the Forest Garden’s ability to sequester carbon and provide participants with additional sources of food and marketable products.
For a farm-by-farm analysis, please refer to the appendix where each Forest Garden is mapped by Baseline and Year 1 along with its critical data. These images provide visual confirmation of the varying states of leaf presence and biomass existing during the early stages of the project. For fields with less biomass, the dry season will bring particular challenges as they will be susceptible to solar heat that dries the soil and high winds that carry the soil away. During the wet season, this soil is also exposed to fast-moving water which often also carries away the nitrogen-rich topsoil. As the Forest Gardens increase their T-LAI and AGB scores, microclimates will be created where the soil is protected, moisture is retained, and temperatures cool so plants can thrive for longer periods. Some Forest Gardens might have significantly higher T-LAI measurements, although there does not appear to be a significant increase in leaf presence. In such cases, note that the T-LAI is calculated using NDVI and the NIR wavelength. While the Green wavelength is difficult for RGB cameras (and humans) to view at 100 to 150 feet in the air, the NIR sensor can more easily capture light reflected by such small leaves.
Conclusion
Trees for the Future is committed to proving the effectiveness of the Forest Garden Approach across the entire context of its implementation: People, Profit, and Planet. The organization has years of data relating to food security, dietary diversity, economic resilience, and productivity to show that the People and Profit behind the Forest Garden are benefiting. The Planet impact indicators are now being directly measured through the analysis of the Forest Garden’s leaf area index. The organization is using a modified formula to calculate the TREES Leaf Area Index (T-LAI) and creating Above-Ground Biomass measurements. TREES staff have successfully completed Baseline and Year 1 analyses for 15 Forest Gardens in Kaffrine, Senegal. The results are, as expected, that the traditional agricultural systems lack significant amounts of leaf biomass at the time of the baseline survey and show remarkable progress after just 10 months of project activities.
“Download original report to see aerials of all 15 Forest Gardens” “https://trees.canto.com/b/QMHV9”
Bibliography
Fan L., Gao Y., Bruck H., Bernhofer C. (2007) ‘Investigating the relationship between NDVI and LAI in semi-arid grassland in Inner Mongolia using in-situ measurements’, Theoretical and Applied Climatology 95 (2009), pp 151-156
Hardwick S.R., Toumi R., Pfeifer M., Turner E.C., Nilus R., Ewers R.M. (2014), ‘The relationship between leaf area index and microclimate in tropical forest and oil palm plantation: Forest disturbance drives changes in microclimate’, Agricultural and Forest Meteorology 201 (2015), pp. 187-195
Schoene D., Killmann W., Lupke H.V., LoycheWilkie M. (2007) “Forests and Climate Change Working Paper 5”, Food and Agriculture Organization of the United Nations, http://www.fao.org/docrep/009/j9345e/j9345e12.htm#P693_33204, accessed 15 Jan 2019.